 Highlight the task you wish to diagnose, and press the Diagnostics button to open the real-time data window.
It is possible to monitor multiple tasks at once if required by using multiple
tabs.
Highlight the task you wish to diagnose, and press the Diagnostics button to open the real-time data window.
It is possible to monitor multiple tasks at once if required by using multiple
tabs.Patriot 6 includes several features which can be used to diagnose and troubleshoot task problems.
Also see System Troubleshooting
To view real-time diagnostic information about the data being sent and received by a task, you can use the diagnostics window. This is accessed from the task settings screen.
System Menu → Tasks → Task Settings
 Highlight the task you wish to diagnose, and press the Diagnostics button to open the real-time data window.
It is possible to monitor multiple tasks at once if required by using multiple
tabs.

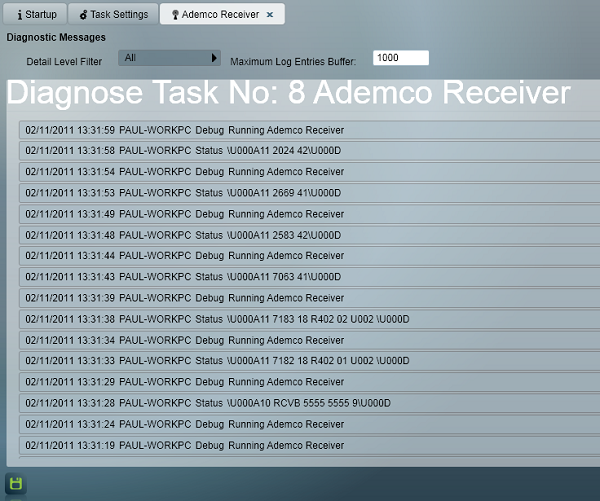
Screen showing diagnostics information from an Ademco Receiver Task
Once the task window has been opened, diagnostic messages will be displayed. The newest messages are displayed at the top of the screen. Each message has date and time information as well as a log level. This log level indicates the priority of the message.
Debug - This level contains verbose information mainly used for debugging purposes. This level is typically used to indicate that the task is still running.
Information - This level contains information related to the normal running of the task. For example, sending heartbeat messages or checking for new emails.
Status - This level contains any incoming messages and signals which the task has received.
Warning - This level contains information about unusual or unexpected situations in the task which may be incorrect.
Error - This level contains information about errors in the task. These are more severe than warnings, but the task was able to recover and continue.
Fatal - This level indicates an error condition which the task was unable to recover from.
The Detail Filter Level Selector allows unneeded information to be hidden. This only affects new messages, so existing message lines are unaffected. The filter level selector only shows messages from the selected level or higher. For example, selecting Warning would show Warning, Error, and Fatal level messages.
 The diagnostics window contents can be saved to an XML file for later
examination. Clicking the Save button on the diagnostics screen saves the
current log contents into the Patriot Version 6 Client folder. The file will be
named Diagnostics, and include the task number and name. Saving this will
overwrite any previously saved log files for this task.
Check Windows Event Log for errors (Control Panel, Administrative Tools, Event Viewer). Patriot logs to the Application log. Both services and the client will log there for errors.
Note that it requires administrative privileges to setup the source in the event log. If you aren't getting any entries in the event log, try logging into the machine as an administrator, and starting up the Patriot client (run as administrator). This should setup the source in the event log and allow other users to then write to it.
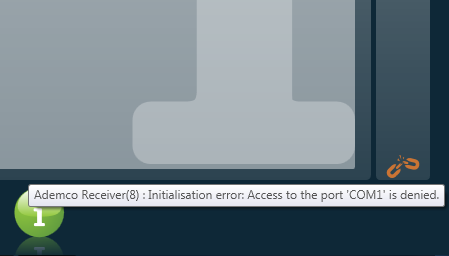
In the right panel is a system status chain icon. If any errors with tasks are detected, this chain icon will turn orange and broken. Hovering over the icon will provide a tool-tip with details of the failure.

System Status Icon, showing that there is a problem accessing the serial COM port.
Diagnostic messages can also be saved automatically by the task as it runs. This saves the same information as the diagnostics window, but automatically records it to a text file as it runs. To enable text logging for a task, first open the task settings. Next, change the Text Log Filter Level drop-down to match the appropriate level of detail required. If recording a text log for playback by Patriot support, the log will need to include the Status level. Once the task settings are saved, the task automatically restarts itself and begins logging. When the required data has been captured in the log, remember to disable text logging again to prevent excessive log growth. Text logging can be disabled by setting the Text Log Filter Level back to None.
In Patriot 6, each task is logged to a separate text file, so it is possible to record multiple tasks simultaneously if required. The log files are recorded into the Task Service install directory as a text file named Task Log.txt, with the task number included in the name.
The log can be viewed using the Patriot Utilities program. Select System->Tasks->Task Log Viewer. Enter the file name and press the start button. For large files this may take a few seconds while it is loaded and processed.
Once the file has been processed, it will be displayed. The log can be filtered as required to find the needed information.
Note: The log file will be saved locally onto the machine hosting the Task Service. Depending on the setup, this might be different from the main server running the Data Service.